
Trust what you see. Test what you read.
A statistic can be accurate and still answer a smaller question than the one Torontonians are asking. When a headline doesn't match the trip, street or park you know, look closer at what the number actually counts.

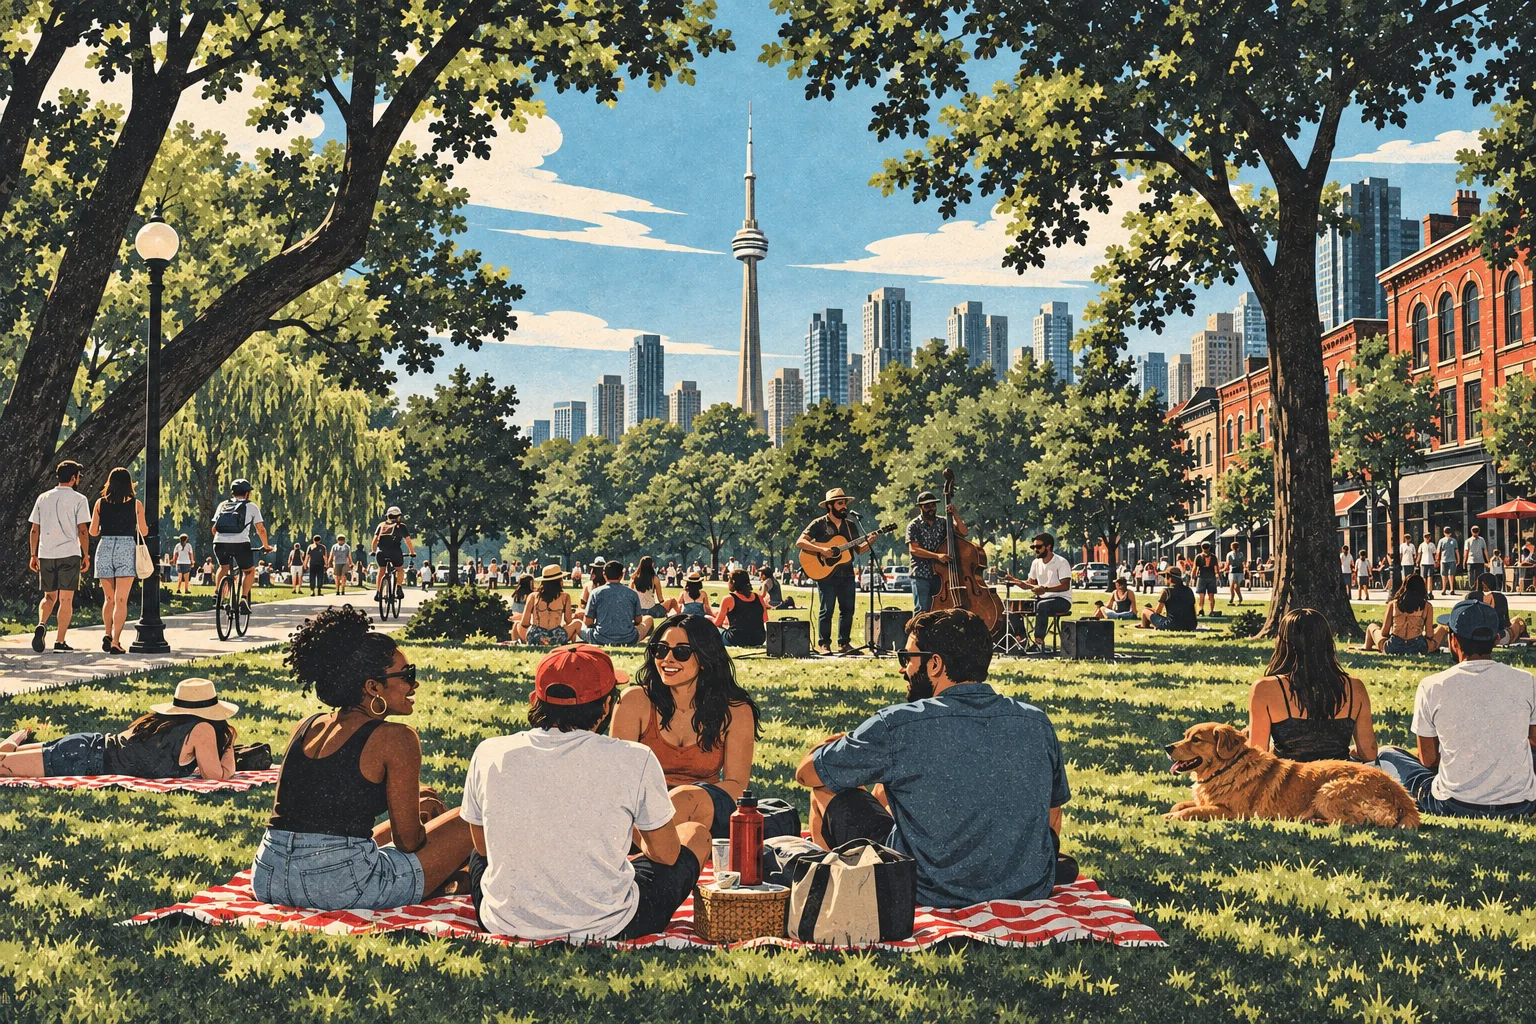
Start with the question
The number may be right. Is it answering the right question?
Don't ignore what you see with your own eyes. A long wait, consumption on a streetcar, a shop struggling to keep its door open or a park you avoid is real. One experience doesn't tell us how often it happens across Toronto. It does tell us what the public measures ought to examine.
A Toronto example
Read the small print under the big number.
Personal-safety satisfaction among surveyed TTC customers.
It reports how customers surveyed about their TTC trips answered a specific question.
How safe all Torontonians feel using transit.
People who no longer ride are outside the stated survey population. This figure can't tell us how many stopped riding because of safety or how they would answer.
That gap is a reason to ask for a broader survey, not a reason to invent a different percentage. See the TTC explanation ↗ · Check the City dashboard ↗
The five-minute smell test
Five questions to ask any reassuring headline.
- 01 See the rider example ↗
Who had a chance to be counted?
The TTC customer survey can describe surveyed riders. It can't describe the views of people who avoid the TTC or stopped riding. Ask who was excluded before a result is called “what Toronto thinks.”
- 02 See the TTC measures ↗
What event does the measure actually count?
Reported offences per million boardings are not a count of every rider who witnessed open drug use, heard a threat or felt unable to stay on a vehicle. Ask which encounters never enter the published series.
- 03 See the longer view ↗
Compared with which starting point?
Toronto metro unemployment fell from 8.8% in August 2025 to 6.8% in August 2026. It was 6.5% in August 2023. Both comparisons are true; a one-year rebound doesn't erase the longer gap.
- 04 See the safety context ↗
Where is the boundary?
A Toronto metro crime index covers a wider region than city limits. It can't tell you what happened on a particular TTC trip, in a community-centre washroom or outside one restaurant.
- 05 See the housing and business counts ↗
Is this a result, or a step toward one?
Housing approvals are not completed homes. A count of active businesses can't show whether a neighbourhood restaurant can pay its staff and stay open. Ask for the outcome people can use.
When the chart and the street disagree
Don't unsee the street. Ask for the missing measure.
Write down what happened, where and when. Check whether the published number was designed to capture that experience. Then ask the agency to publish the missing measure and its method. Firsthand accounts expose blind spots; repeated, well-designed measurement shows their scale.
For the TTC, that could mean asking riders and former riders about witnessed drug use, harassment, long waits and whether help arrived. For parks and businesses, it means tracking usable facilities, reported hazards, response times, openings and closures. A city that listens to residents should be willing to test its dashboard against their lives.
Check the sources yourself.
We link to the underlying sources and keep the date, geography and unit visible. Figures on this site are reviewed manually; a source may publish a newer release later.
What the labour rates mean
Unemployment rate: people without work who are seeking it, as a share of the labour force. Employment rate: employed people as a share of the population aged 15 and older. Participation rate: people working or seeking work as a share of that population. The metro comparisons use August readings from the same seasonally adjusted three-month moving-average series. A move from 8.8% to 6.8% is a 2.0-percentage-point fall.
Who collects a number, and who paid for it?
The City dashboard publishes TTC-supplied measures. A source's stake in the result is a reason to check definitions, question wording, exclusions and raw methodology; it isn't proof a figure was altered. For an outside poll, ask who commissioned it, chose the questions, paid for it and released the full method.