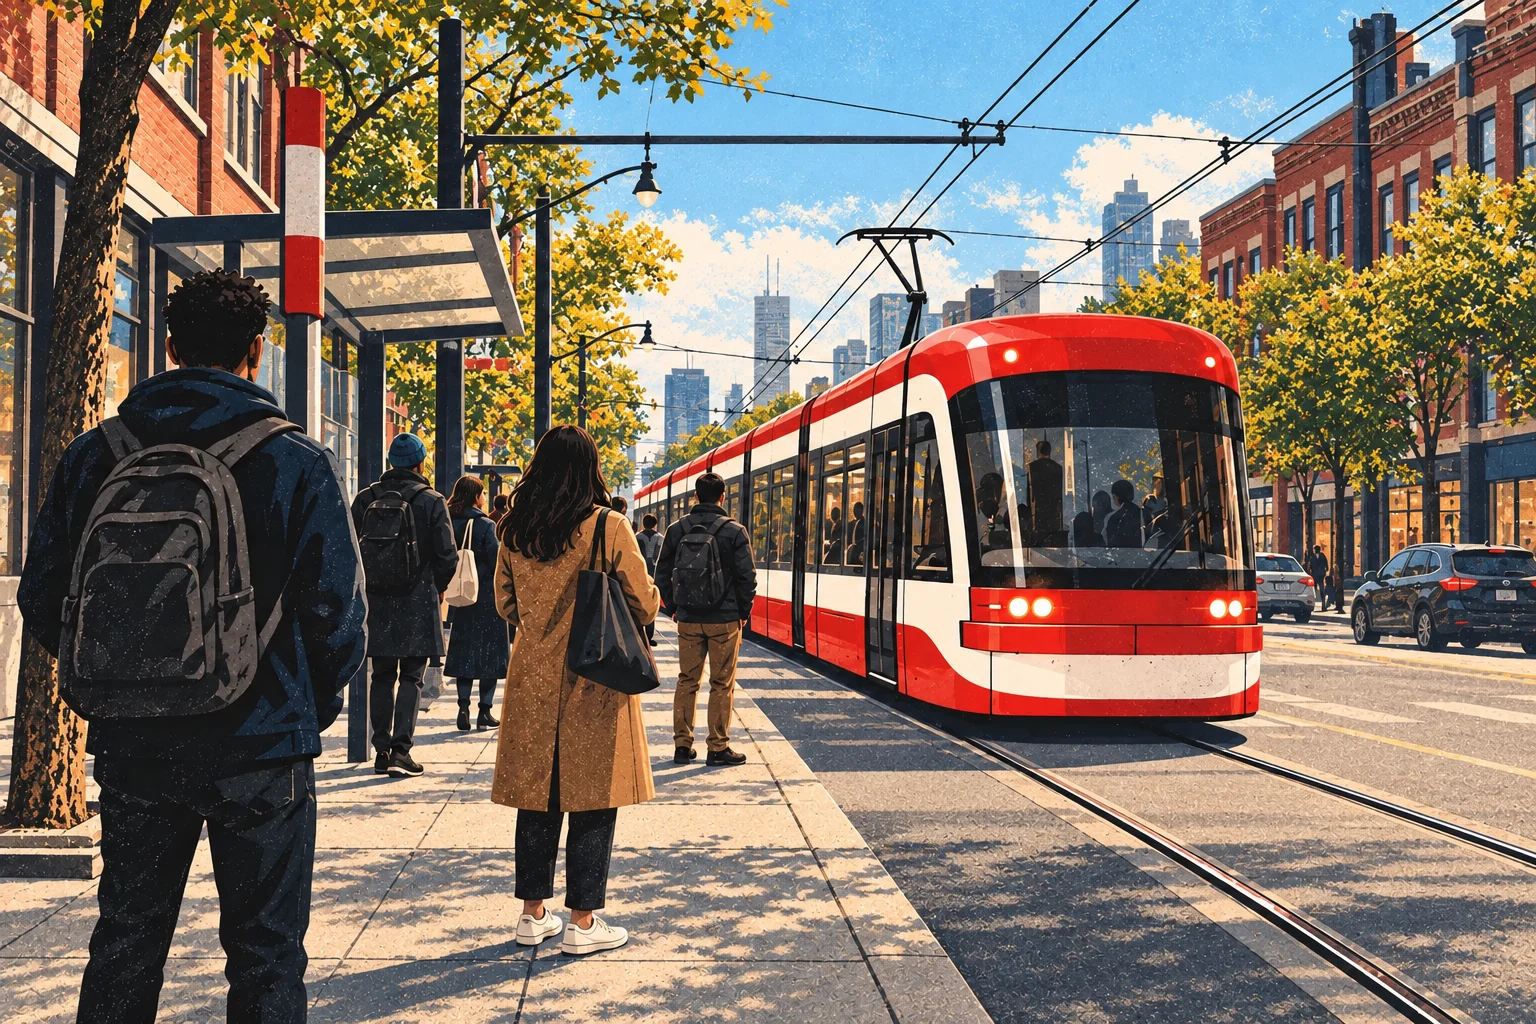
A safe TTC has to work for the whole trip.

Toronto should judge transit by the trip people actually take: the wait, the ride, and whether they feel able to use it again. A favourable dashboard number is only part of that test.

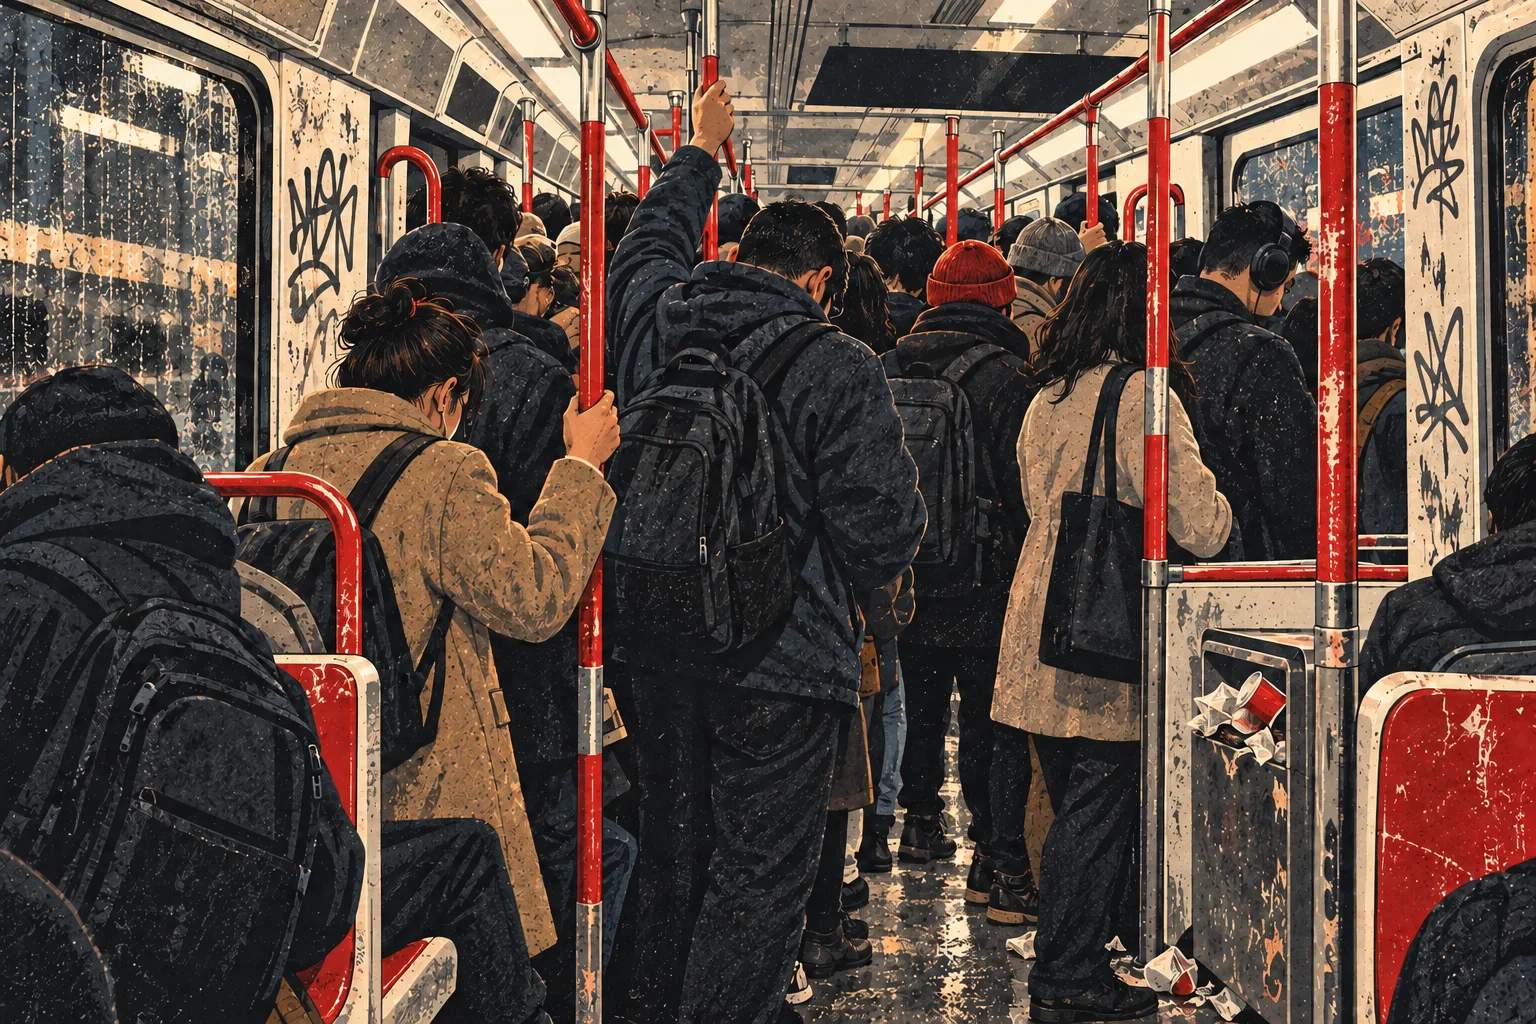
Print-style scene inside an overcrowded, grimy TTC subway car with graffiti
A crowded ride.
Print-style scene of commuters waiting for a TTC streetcar at a street-level Toronto stop
A calmer streetcar stop.

From the ride

What a number can miss.

These public rider discussions raise questions the published measures don't fully answer. Read the accounts and the figures together.

Streetcar reliability

A promised six-minute service can still leave a rider waiting half an hour.

In a discussion of TTC on-time figures, riders describe bunched streetcars, long waits and trips that require extra buffer time. Those are practical measures of reliability that a systemwide punctuality figure can't fully describe.

Read the rider discussion ↗
Streetcar substance use

One incident can change the whole ride.

Riders discuss consumption on a streetcar, whether to alert the operator or use SafeTTC, and concern about confronting someone directly. Experiences differ: one frequent rider said they had seen smoking only twice. The thread can't establish how often it happens.

Read the rider discussion ↗

Two concerns on the same ride

People deserve safety. People in crisis deserve help.

These public discussions show why transit drug use can't be reduced to a single satisfaction score or a single enforcement answer.

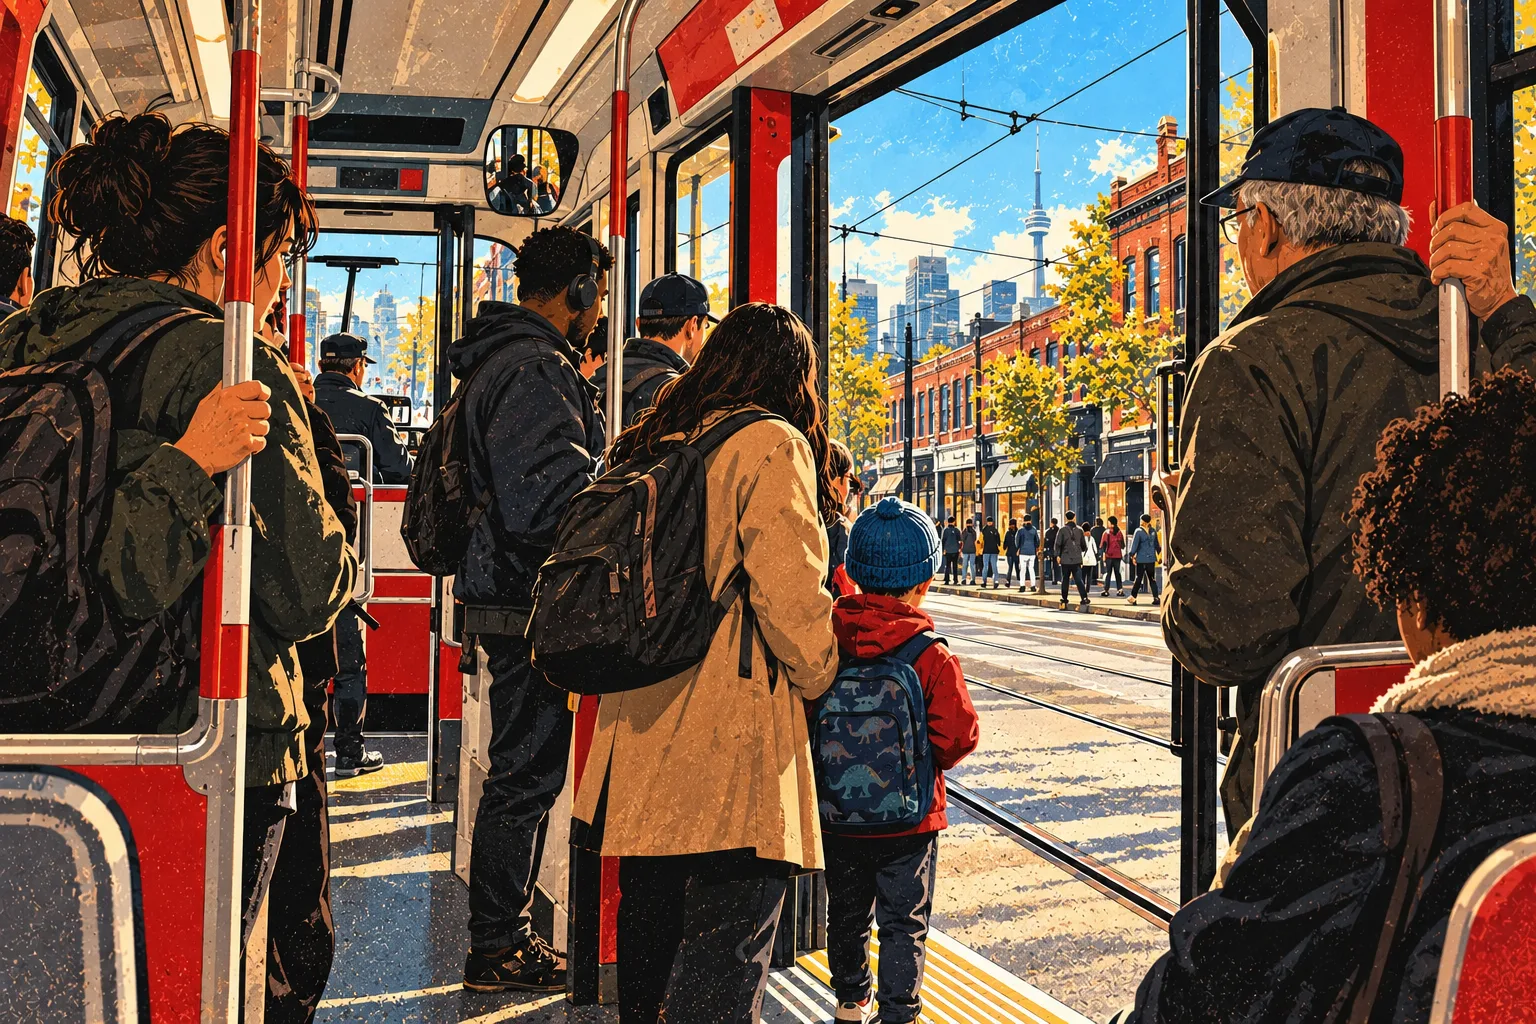
Illustration from inside a Toronto streetcar, with riders standing near the doors and Queen Street visible outside
Inside the car

Who makes a shared ride safe?

In a discussion about proposed powers for TTC special constables, one commenter described seeing people smoke what they believed was crack on a subway car with children present. Their question was direct: how can riders be protected from smoke in a confined space?

“As much as they deserve safety, so do I.”

A rider's account in the public discussion ↗

Beyond the car

Who helps the person in crisis?

Another commuter wrote that seeing people struggling with addiction on their daily trip was emotionally exhausting and asked how to respond. Many replies urged compassion, outreach, treatment and housing support. The thread shows distress for the commuter and for people visibly in need.

“How to cope? Look away and ignore?”

The original poster in a separate Toronto discussion ↗

The decision to test

The special-constable thread links to a February 2026 report about a proposed expansion of arrest powers. The discussion doesn't establish what powers are in force now or whether arrests would make trips safer. Any change should be judged by rider exposure to drug use, time to help, referrals to care and harms caused by the response.

What the published measures count

1.6 Reported customer offences Per million TTC boardings in August 2026. This is a rate of reported offences, not all uncomfortable encounters.
915 Safety-related officer call reports August 2026. Multiple officers can report the same event, so this isn't a count of unique incidents.

Source: City of Toronto Transit Community Safety Data. TTC supplies the customer survey and transit-operation data shown on the City dashboard. These figures count specific outcomes; they are not a verdict on the whole rider experience.

Who had a chance to answer?

66% personal-safety satisfaction among surveyed TTC customers, August 2026

That 66% comes from current riders. It doesn't include people who've stopped taking the TTC.

Included in the measure

TTC customers surveyed about trips they took

The City's dashboard describes this as a monthly TTC customer-satisfaction measure of personal safety during TTC trips. The 66% result belongs to that group.

Outside the stated survey population

People who are not riding

Some may have stopped riding because they feel unsafe. We don't know how many, why they stopped, or how they'd have answered the survey.

Our concern: reporting this as “Torontonians feel safe on the TTC” would overstate what was measured. A rider-only satisfaction result can improve while the views of people who left the system remain invisible. Toronto should publish research that includes riders, former riders and non-riders, with the question wording and sample method.

Count the experience, not just the offence.

The TTC dashboard tracks reported offences against customers, safety-related calls and rider satisfaction. Calls can concern criminal and non-criminal events, including disturbances, harassment, intoxication and people in crisis.

Each series uses a different denominator or unit. The offence rate counts reported offences per million boardings; the call total can include multiple officer reports about one event. Neither is a count of every encounter that makes a ride feel unsafe.

What the public dashboard still misses

  • Witnessed open drug useThe public TTC dashboard doesn't publish a separate rider-exposure count.
  • Verbal harassment and fare evasion togetherPublished data don't link a harassment report to the alleged offender's fare-payment status.
  • Unreported experiencesReported-offence data can't estimate how often an event went unreported.
  • People who avoid the TTCThe survey asks current riders. It leaves out people who've stopped taking the TTC, whether because of safety, reliability or something else.

Reliability is part of the trip

The wait is part of the ride.

The TTC's live homepage compares bus and streetcar on-time performance with a 90% target. Those readings change. A durable assessment needs the trend and the waits riders experience at their stops, not one captured dashboard reading.

In a Toronto rider discussion about an earlier TTC dashboard screenshot, commenters described streetcar bunching, long gaps and missed arrival times. The thread isn't a representative survey, but it identifies the question a rider-facing measure must answer: how long did people wait, and did they arrive when they needed to?

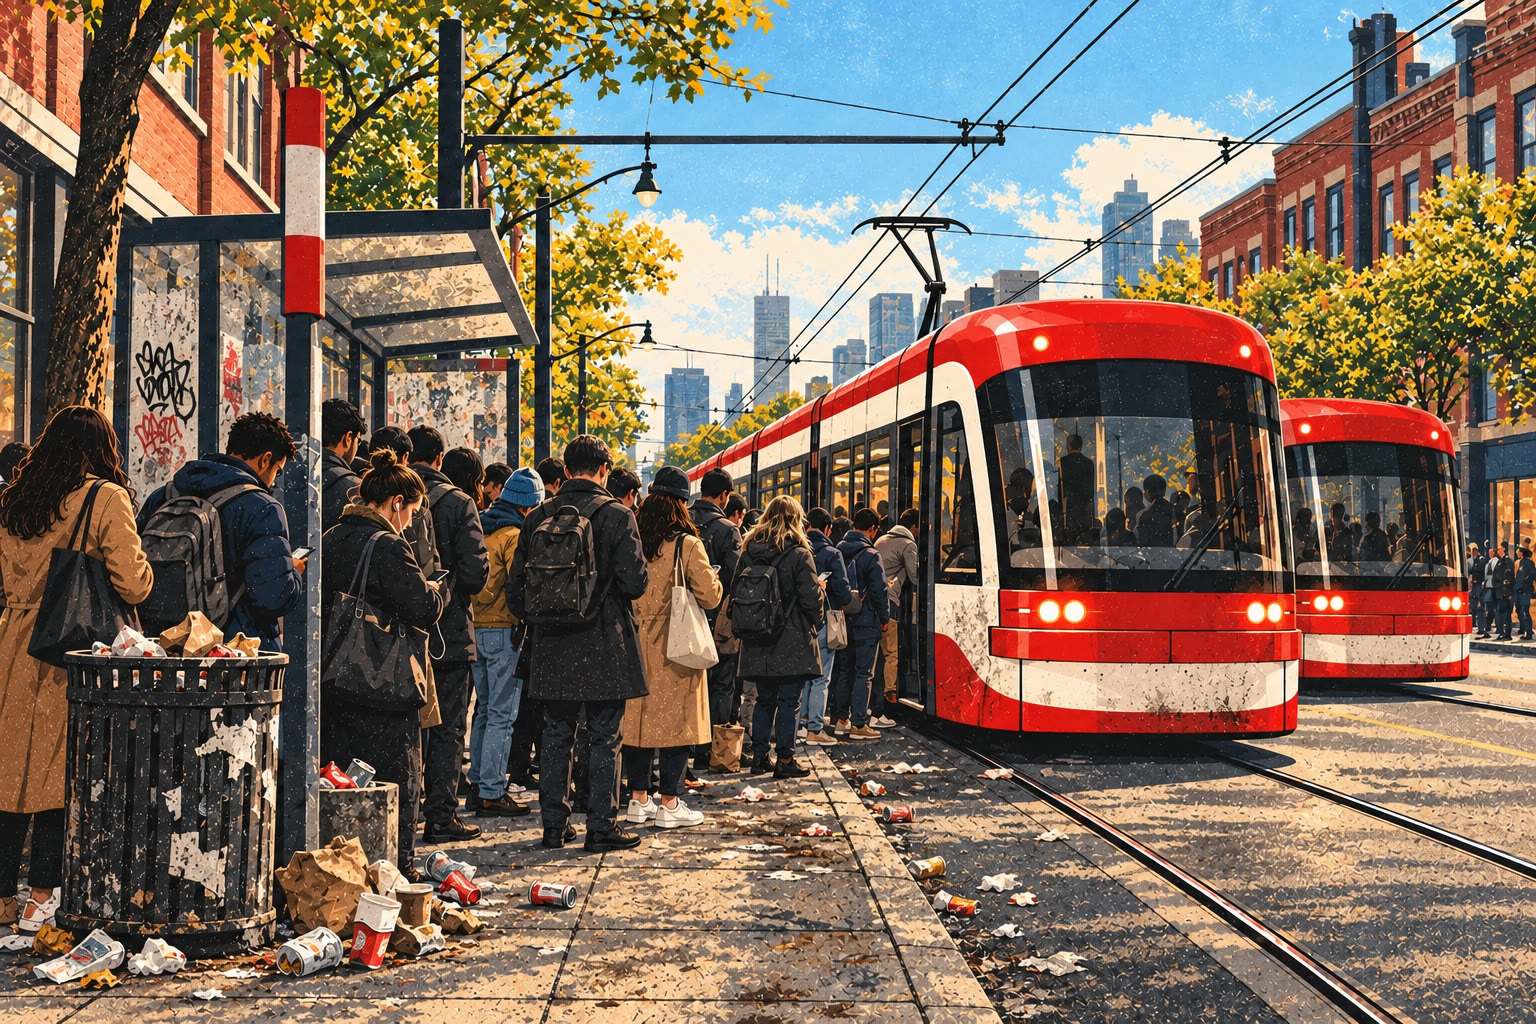
Print-style view of a crowded, littered streetcar stop with two streetcars arriving close together
Two cars together can follow a long gap.
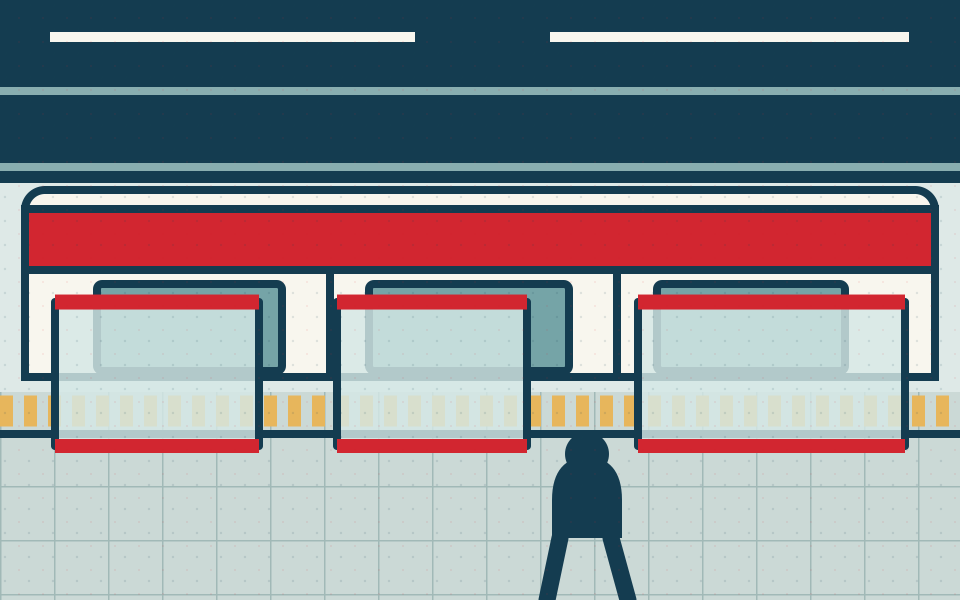
Graphic of partial barriers along a TTC subway platform

Safety spending

What would the barrier pilot prevent?

Global News reported that the TTC's first partial subway-barrier pilot could cost up to $2 million. Riders in a public discussion disagree about whether partial barriers are a useful first step or money better spent on fuller protection and other needs.

The test before scaling up

Publish the cost, the safety outcomes the pilot intends to change, the results after installation, and how it compares with other options. The debate alone can't prove that barriers succeed or fail.

The September 2026 safety poll

A city ranking isn't a TTC trip.

“Safer than people think” compares two rankings. It can't settle what riders encounter on a platform or vehicle.

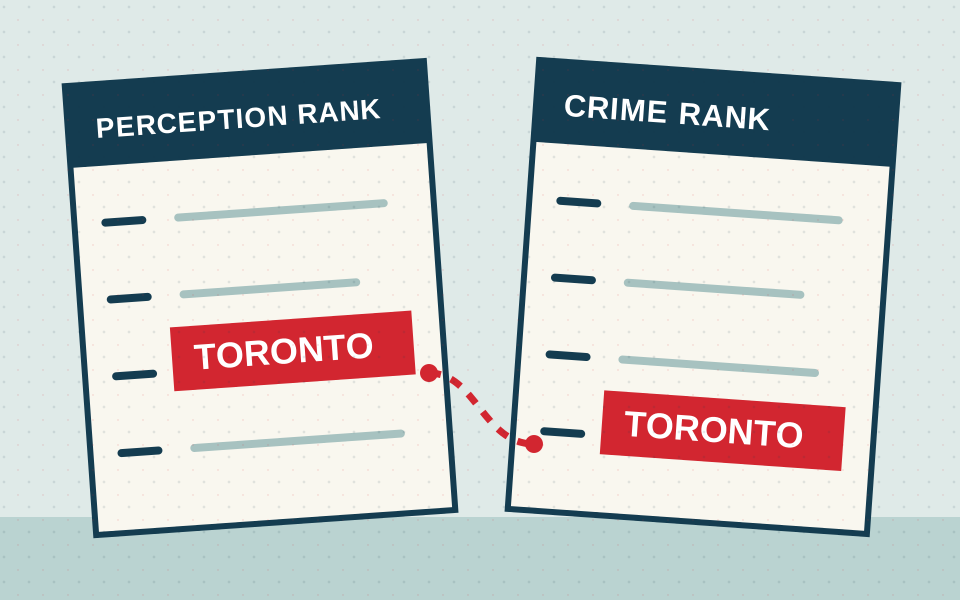
Two ranked lists placing Toronto differently for perceived safety and reported crime

Liaison Strategies asked 1,500 adults across Canada how safe they considered 15 cities. Toronto's net perceived-safety score was −18: the share calling it safe minus the share calling it unsafe. An 11-place rank gap isn't an 11-point difference in a crime rate, nor a measure of any individual's risk.

The reported ±2.53-point margin of error applies to the national sample, not a Toronto-resident subgroup. The answers include impressions held by people who don't live or ride transit here.

55.0

Toronto metro Crime Severity Index, 2025. Statistics Canada reports that it fell 7% from 2024. That decline should be stated accurately. This police-reported index doesn't measure unreported encounters, witnessed drug use, or how safe a TTC trip feels.

Citywide violence is a separate series.

Statistics Canada counted 2,843 police-reported firearm-related violent-crime incidents in the Toronto census metropolitan area in 2024: 44.8 per 100,000 people, up 12% from 2023. This includes incidents where a firearm was present and relevant even if it was not fired, as well as firearm-like weapons under the report's definition.

Read the Statistics Canada report
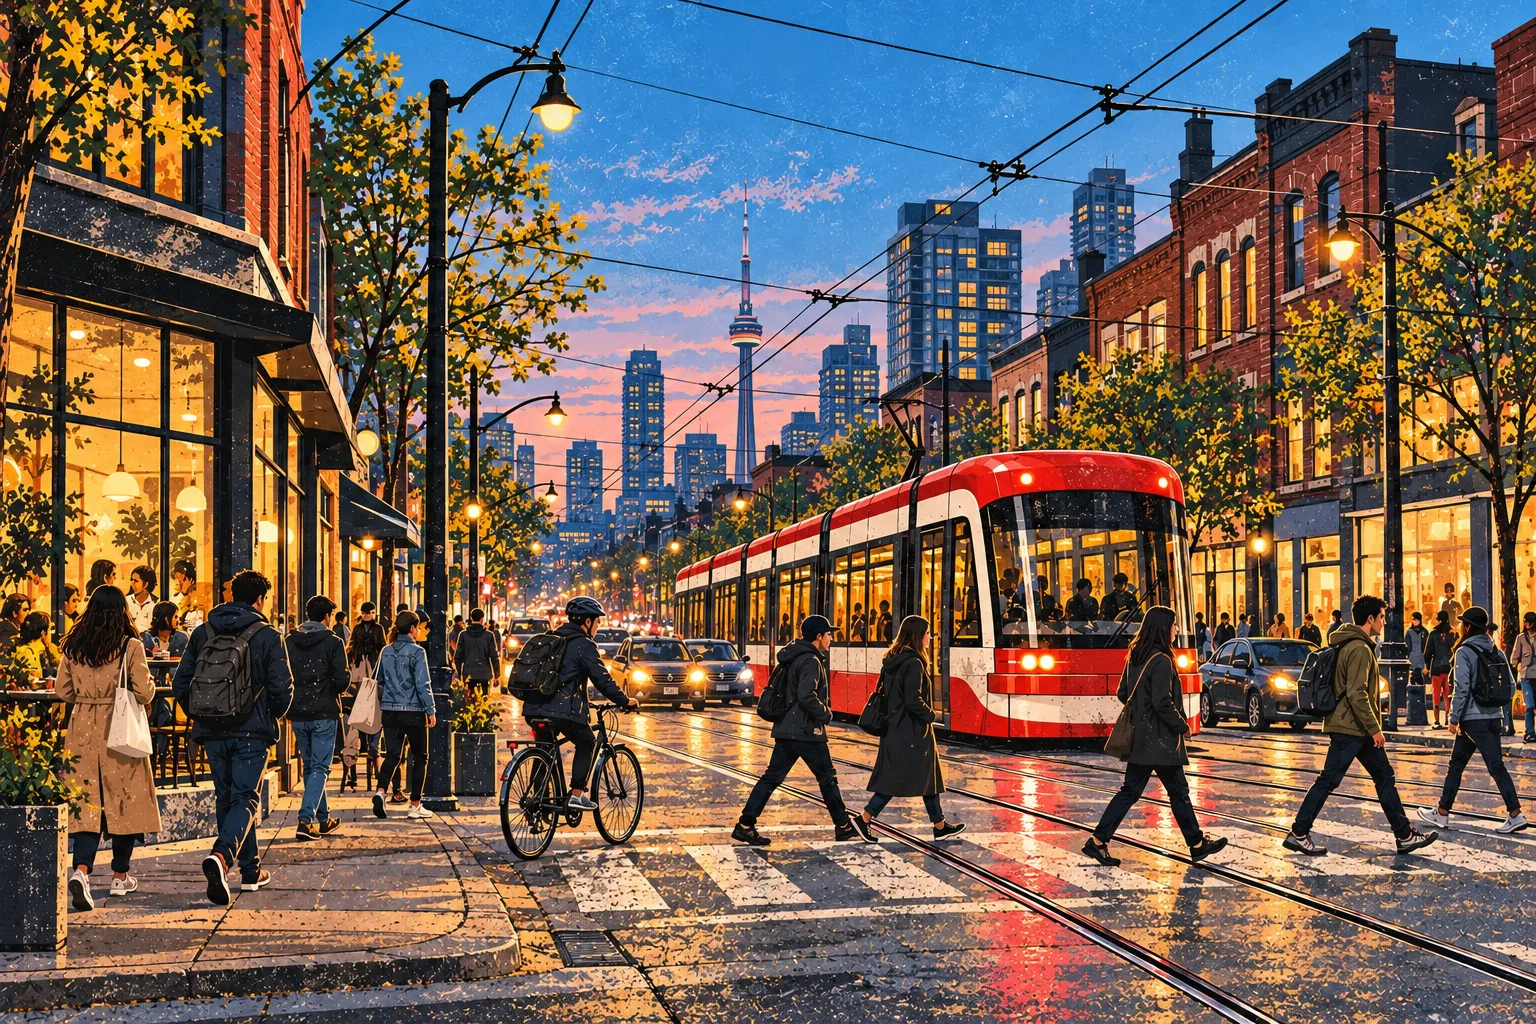
Illustrated Toronto street at dusk with a streetcar, pedestrians, shops and the CN Tower in the distance

Beyond an annual average

Some events change how a place feels.

CTV reported shots fired at a Queen West restaurant twice in nine days in February 2026. Nobody was injured in either incident, but nearby residents and workers described being frightened. Global News reported a July 2026 shooting at the U.S. Consulate; police later announced charges against two suspects. No injuries were reported there either.

What those reports establish

These are documented events and legitimate reasons to ask how public spaces are protected. They don't, by themselves, show whether shootings are becoming more common or whether a particular city policy caused them. The citywide firearm-related series above addresses a different question: how the measured rate changed over time.

The rider's test

Show us the trip, not just the dashboard.

At the stopReport long waits and bunched vehicles alongside on-time percentages.

On boardShow how often riders encounter smoking, harassment and other disruptions.

After a call for helpExplain how quickly help arrives and whether riders feel safe using the system again.

These measures would make it easier to judge whether the TTC's stated safety response is working. The firearm-related series above covers the wider Toronto metro area; it should not be combined with TTC measures into a single safety rate.